The Module Outcomes tab provides a detailed analysis of individual verification modules and their variants. It focuses on execution performance, outcome distribution, and comparative analysis across different module configurations.
Key metrics
The top section displays three essential module performance indicators:
- Module executions: Shows the total number of times verification modules have been executed across all journeys.
- Unique modules: Displays the number of distinct module types.
- Unique variants: Shows the number of different module configurations or variants being used. Variants represent different settings or regional configurations of the same module type.
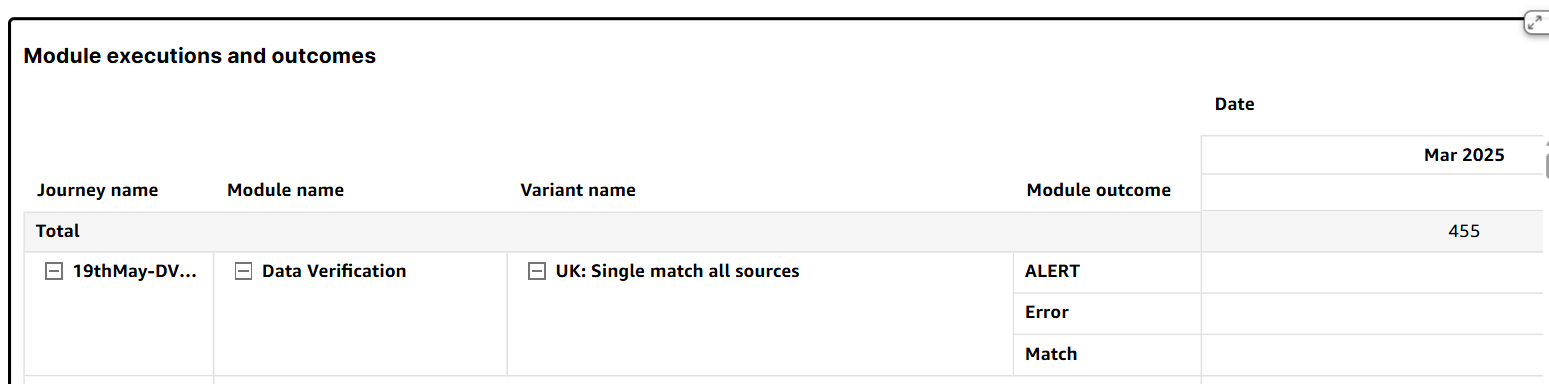
Module execution and outcomes
This table provides a detailed breakdown of all journey sessions, modules, and outcomes.
In the table above you can see:
- Journey name: Name of executed journey session
- Module name: Name of the processing module selected as a verification step in a customer journey
- Variant name: Name of module variant executed in a journey
- Module outcome: Verification outcome of a module, example:
- Can Not Confirm Age
- Match
- No Match
- Error
- Date: Date of journey session execution
- Total: Total number of module outcomes
Click on the collapsible icons to view more or less information on modules.
Module executions
This bar chart displays execution frequency for each module type. The modules are displayed in descending order, showing the most frequently executed modules at the top.
Variant executions
This bar chart displays execution frequency in descending order for each module variant. The variants are displayed in descending order, showing the most frequently executed variants at the top.
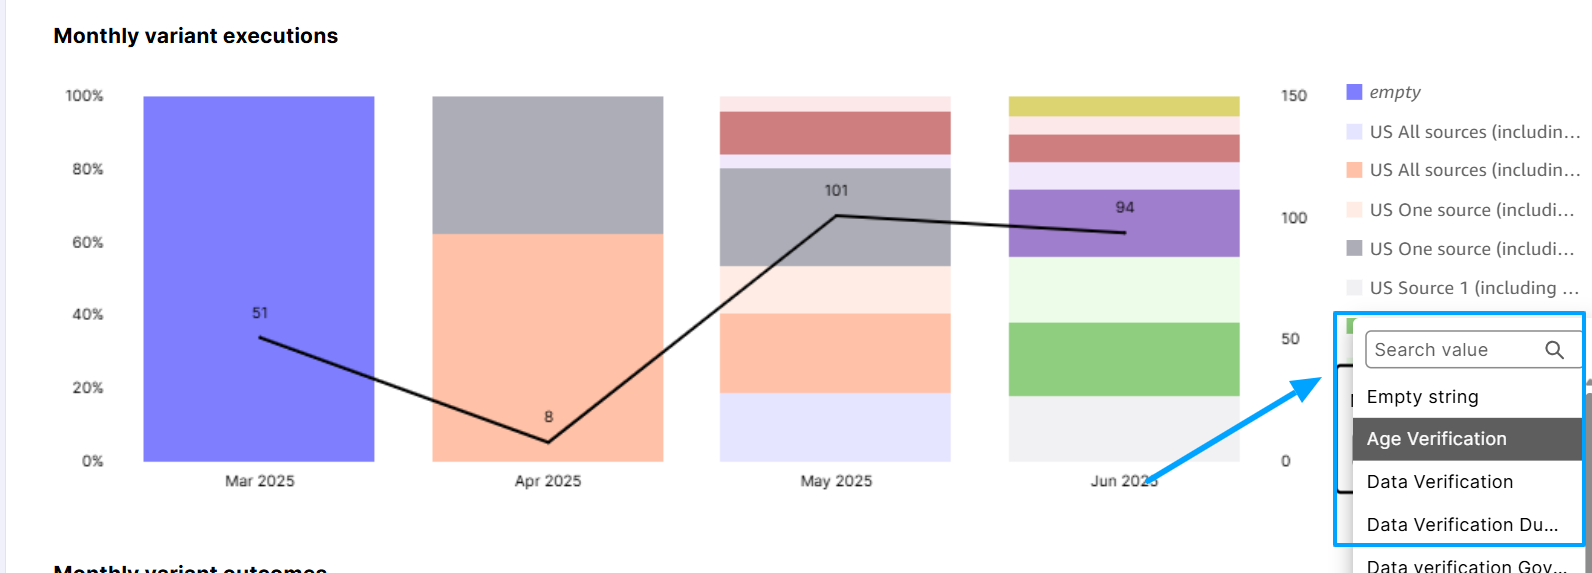
Monthly variant executions
This is a stacked chart that shows individual module variant performance, with an overlayed line displaying the total number of executions for each time period (day, week, or month).
You can drill down into a frequently executed module and view its variant performance over time.
To do this, navigate to the Module name list at the bottom right of the Module variant executions section, and select a module. You will see a comparative line chart with the module and variant performance over time.
The variants displayed depend on your selected module. When you select a module, only its variants will appear in the chart.
To view detailed outcomes for a specific variant, select it in the Monthly variant outcomes section (described below).
Monthly variant outcomes
This chart tracks the most commonly encountered variant outcomes over time. To do this, navigate to the Variant name list at the bottom right of the Monthly variant outcomes section, and select a variant. You will see a comparative line chart with the variant outcomes over time.
Distribution of outcomes by module
This is a table with a detailed outcome analysis organised by module type. In the table, you have the following columns for analysis:
- Module executions
- Percentage of total executions
- Percentage of module executions
- Total
Distribution of outcomes by variant
This is a table with a detailed outcome analysis organised by specific module variants.
The table displays the following metrics for each module variant:
- Variant executions
- Percentage of total executions
- Percentage of variant executions relative to other variants