Key metrics
The top section displays four main decision performance indicators:- Journey sessions: Shows the total number of journeys executed.
- Journeys ended: Shows the total number of journeys that have ended, regardless of the journey status, for example, complete, error, timeout.
- Journeys ended successfully: Shows the number of journeys that were completed with a complete status. This excludes other statuses for completed journeys, such as error or timeout.
- Journey success rate: Shows the proportion of journey sessions that completed successfully without errors or timeouts.
Final evaluation decisions
This table provides a detailed analysis of the final evaluation decision.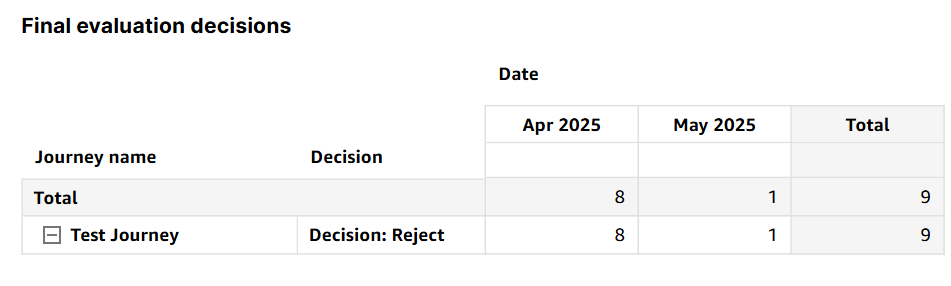
- Journey name: Name of the journey evaluated
- Decision: Final journey decision
- Date: Timeframe for decision data
- Total: Total number of final decisions in a specified timeline
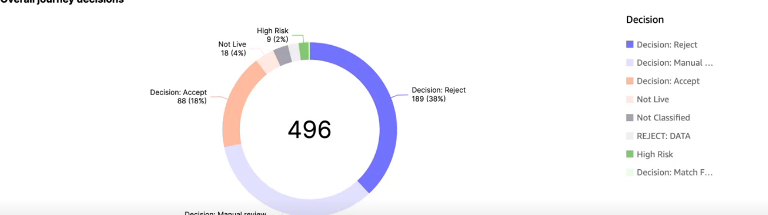
Overall journey decisions
This donut chart provides a visual summary of all final verification decisions.