- Review all submitted information.
- Examine document images.
- Validate identity claims.
- Check for potential fraud signals that might not have been automatically detected during the initial verification process.
Switch between environments
GBG GO provides two separate environments for Investigation:- Production environment Contains live customer verification sessions.
- Preview environment: Contains test verification sessions.
Switch between regions
The GBG GO platform allows you to switch between different geographical regions when investigating customer verification sessions. This feature enables you to access region-specific customer data based on where their verification was processed. For more information about regional endpoints, refer to the API reference overview documentation.Available regions
The region selector in the top-right corner of the Investigation dashboard provides access to verification data processed in different geographical locations: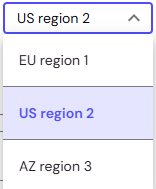
- EU region 1: Verification data processed through European Union endpoints.
- US region 2: Verification data processed through United States endpoints.
- AZ region 3: Verification data processed through Australia/New Zealand endpoints.
The available regions displayed will correspond to the functions assigned to the user’s role in PingID.
Switch regions
To change the active region:- Click the region list in the top-right corner of the Investigation dashboard.
- Select the desired region. The dashboard then displays sessions from the selected region.
FAQ
How do I get granular failure reasons for document verification?
How do I get granular failure reasons for document verification?
You can access detailed failure reasons in two ways:
Every API response also includes an
- Through the v2 API error response
- Through the Investigation portal.
v2 API error responses
The v2 API returns structured error objects that include a machine-readable error code, a description of the problem, and a recommended action. Each error specifies where the issue originated, making it easier to diagnose failures programmatically.| Field | Description |
|---|---|
code | Numeric error code (returned as a string). |
name | Machine-readable error identifier (for example, MISSING_FIELD). |
location | Where the error originated: Body, Authorization, Path, or Service. |
problem | A description of what went wrong. |
action | What you should do to resolve the error. |
X-Request-ID header. Include this value when contacting GBG support. It correlates your request with server-side logs for faster troubleshooting.Investigation portal
For document-specific verification failures, the Investigation portal provides the most detailed view. To access granular failure reasons:- Log in to the GBG GO platform and navigate to the Investigation section.
- Click the Session ID of the session you want to review. This opens the session detail view, which shows an overview of the session.
- Navigate to the Processing tab to see each module’s outcome, for example, Match, No Match, or Error.
- Expand any module section to see a breakdown of individual data point matches.
- Click More details to open the module detail view. The available tabs vary by module type.
- Check the Raw Response tab for the complete response from the verification provider, which contains the module errors and reasons.
How do I access the preview/sandbox environment?
How do I access the preview/sandbox environment?
GBG GO provides two separate environments:
- Preview environment: A test environment where you can validate journeys before deploying them to production. Use this to test API calls, verify journey behaviour, and confirm that modules are configured correctly.
- Production environment: The live environment where published journeys are used by real customers.
- Open your journey in the Journey builder.
- Click Publish to Preview.
- A confirmation message appears: “Delivery deployed successfully”.
- Click Dashboard, where you can see the environment label (Preview), version number, resource ID, last published date, and the auto-generated schema.
- Navigate to Investigation.
- Click the Preview Environment tab.