> ## Documentation Index
> Fetch the complete documentation index at: https://docs.go.gbgplc.com/llms.txt
> Use this file to discover all available pages before exploring further.
# View time spent per module
> Analyze average execution times for each module and variant in GBG GO to identify performance bottlenecks.
The *Time spent per module* tab provides detailed performance analysis on the average execution time per module and variant.
## Key metrics
The top section displays three main timing performance indicators:
* **Distinct modules**: Shows the count of distinct module types currently being tracked for execution timing
* **Distinct variants**: Displays the number of distinct module variants being tracked for execution time
* **Average execution duration**: Presents the mean processing time across all module executions
## Variant execution duration
This table provides a detailed timing analysis of module variants in a table.
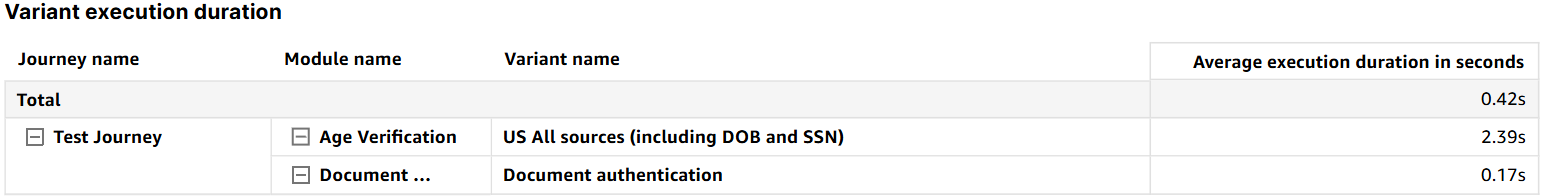 * **Journey name**: Name of executed journey
* **Module name**: Name of executed module
* **Variant name**: Name of module variant
* **Average execution duration in seconds**: Mean time taken for variant execution
## Average execution duration per module
This bar chart shows the average execution duration per module.
## Average execution duration per variant
This bar chart shows the average execution duration per variant.
## Variant execution duration per journey
This section provides journey-specific timing analysis with filtering capabilities for viewing variant execution duration per journey.
* **Journey name**: Name of executed journey
* **Module name**: Name of executed module
* **Variant name**: Name of module variant
* **Average execution duration in seconds**: Mean time taken for variant execution
## Average execution duration per module
This bar chart shows the average execution duration per module.
## Average execution duration per variant
This bar chart shows the average execution duration per variant.
## Variant execution duration per journey
This section provides journey-specific timing analysis with filtering capabilities for viewing variant execution duration per journey.
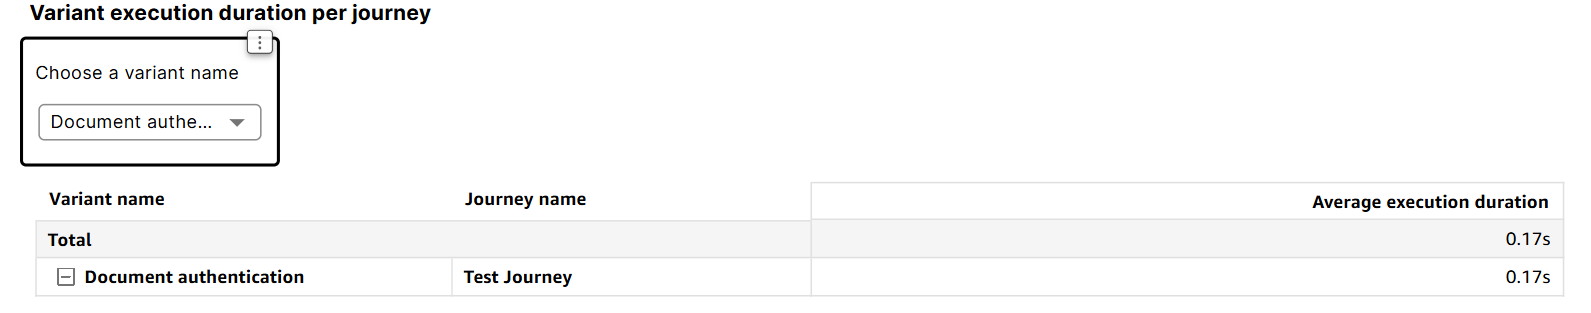 When you select a variant name from the **Choose a variant name** list, a table appears, giving you details that include:
* **Variant name**: Name of module variant
* **Journey name**: Name of journey being executed
* **Average execution duration**: Mean duration for variant execution in that given journey
When you select a variant name from the **Choose a variant name** list, a table appears, giving you details that include:
* **Variant name**: Name of module variant
* **Journey name**: Name of journey being executed
* **Average execution duration**: Mean duration for variant execution in that given journey